|
Bind
C++ UI framework for Arduino
|
|

| |
|
Bind
C++ UI framework for Arduino
|
|
|
| |
Represents a customizable chart element for BindCanvas. More...
#include <BindChart.hpp>

Public Member Functions | |
| uint16_t | getBytes (uint8_t *out) override |
| Generates and returns the byte data representing the chart configuration. | |
| uint16_t | getDataBytes (uint8_t *out, float chartData) |
| Generates and returns the byte data representing chart data. | |
Public Attributes | |
| int16_t | x = 0 |
| X-coordinate position of the chart. | |
| int16_t | y = 0 |
| Y-coordinate position of the chart. | |
| uint8_t | cmdId = 0 |
| Command ID for the chart. See the notes for possible cmdId values. | |
| int16_t | width = 200 |
| Width of the chart. | |
| int16_t | height = 100 |
| Height of the chart. | |
| int16_t | maxY = 10 |
| Maximum Y-axis value of the chart. | |
| int16_t | minY = -10 |
| Minimum Y-axis value of the chart. | |
| int16_t | maxX = 20 |
| Maximum X-axis value of the chart. | |
| bool | autoSize = true |
| Flag to enable auto-sizing based on data. | |
| int32_t | color = YELLOW |
| Color of the chart. | |
 Public Attributes inherited from BindView Public Attributes inherited from BindView | |
| int16_t | tag |
Represents a customizable chart element for BindCanvas.
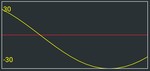
The BindChart class provides the capability to create and display customizable charts within a BindCanvas interface. Users can define various attributes of the chart, such as its position, size, color, data ranges, and more. Additionally, users can dynamically update the chart data using the bind.sync([float chartData], &myChart) function.
Example usage:
BindChart object to represent the chart element.bind.sync(myChart).bind.sync(136.36f, &myChart) function.
|
inlineoverridevirtual |
Generates and returns the byte data representing the chart configuration.
This function is meant for internal use by the Bind framework and should not be called directly by users. It serializes the chart configuration properties into a byte array for communication with BindCanvas.
| out | Pointer to the output byte array. |
Reimplemented from BindView.
|
inline |
Generates and returns the byte data representing chart data.
This function is meant for internal use by the Bind framework and should not be called directly by users. It serializes the chart data properties into a byte array for communication with BindCanvas.
| out | Pointer to the output byte array. |
| chartData | The data to be added to the chart. |